
A Method for Adding A Timeline to a Chronological Summary
When Events Choose Their Own Times
Introduction
How does one record a chronology on a single-side of a sheet of paper and at the same time give a sense of the linear passage of time when the intervals between events are not regular?
A simple listing will suffice if, say, events occured a month apart, January, February, March etc. But the key stages of a project, influenced by many factors, run to their own timescale, not that set by the regular motion of our planet.
My father, Jim Shaw, working as a vehicle development engineer for the Rover company of Solihull, England faced that problem when reporting to senior management the sequence of events leading up to a major problem and the steps taken to resolve it.
A Solution
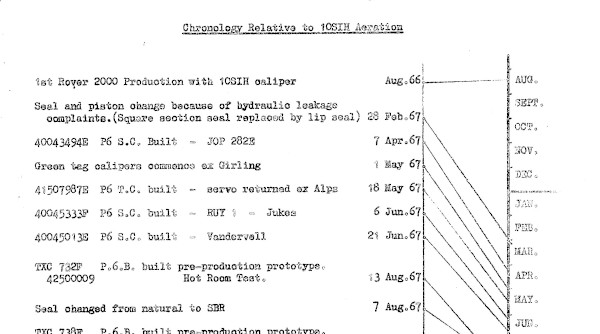
His solution, created some time in 1968, was to make a list of events on the left side of the page and to add a linear time scale on the right side of the page. A line drawn from each event on the left side linked it to its place in the time sequence on the right side, giving a simple graphical representation of when each event occured during the project programme.
Events Out Of Sequence
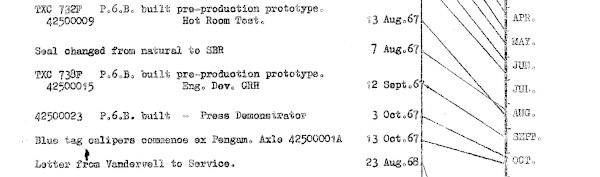
It often happens that not only do events not occur according to the project plan but they occur out of sequence, the project clock almost goes back in time! My father's method easily coped with this; the events being listed in their logically planned sequence but the crossing over of the links to the time scale instantly showing where the project plan had been disrupted.
This tool was used in many of my father's reports over the years and was something that I think he took a pride in inventing.
A Solution For Web Pages
Many years later I took on the task of transcribing my grandfather's diary written during his period of army service in (German) East Africa. Clearly key events here were subject to 'the fortunes of war', not the calendar. I wanted to give some sense of the passage of time and the relationship of an event to my grandfather's time in his war and to its place in the Great War, or World War 1 as it came to be known.
As I was recording each event as written in the diary my listing was far longer than what would have fitted on a single-page summary sheet. Clearly a vertical, linear timescale, as used by my father, would be impracticable. My solution was to add horizontal time bars heading each set of monthly entries, as shown here:-
June 1916
23 June 1916
Finish signalling exam. Sending on buzzer and flags. Weather very wet in forenoon. Parade
1:45 p.m. to battery. Chosen for East African draft,. Pack and stores kit bag and bedding
at
Browndown. Parade 4:20 march to Brockhurst. Measured for men's rigout. Get pass and pay and
march
to Brockhurst station. Leave at 7:16 p.m. Leave London 11:15 p.m.
The span of the black bar represented the total period of his war, August 1914 - February 1919, the red bar represented the month in relation to the period of the Great War and the blue bar the elapsed proportion of my grandfather's war service.
Rather than create a multitude of bar graphics that may need to be re-drawn if I made an error in recording the date of an event or in my calculations the grapics are produced automatically by the CSS, (Cascading Style Sheet), that defines the format of the diary web page. I provide the numbers, the style sheet looks after the graphic!
The style sheet contains this code:-
.bar {
600px;
}
.square {
height: 5px;
}
and the bars called up within the web page as required with appropriate percentage values.
<div class="bar">
<div class="square" style="width: 100%; background-color:black"></div>
<div class="square" style="width: 40%; background-color:red"></div>
<div class="square" style="width: 9%; background-color:blue"></div>
</div>
It saddens me a little that many of the computer tools that we now take for granted were not available to my father during his working life as I am sure he would have made good use of them. He did leave a legacy of creativity that those that follow could do well to try to emulate.